Tokyo's Crime Rate Tells a Complicated Story: What the Numbers Reveal About Public Safety in 2026
As reported incidents shift across wards, data analysts are challenging assumptions about where danger actually lurks in the capital.
As reported incidents shift across wards, data analysts are challenging assumptions about where danger actually lurks in the capital.
Tokyo's Metropolitan Police Department released its mid-year crime statistics on Monday, and the numbers paint a portrait of a city where conventional wisdom about safety doesn't always align with reality. Across the 23 special wards, reported crime incidents totalled 18,347 cases in the first half of 2026—a 3.2% decrease from the same period last year, yet the distribution tells a more complex story than headline figures suggest.
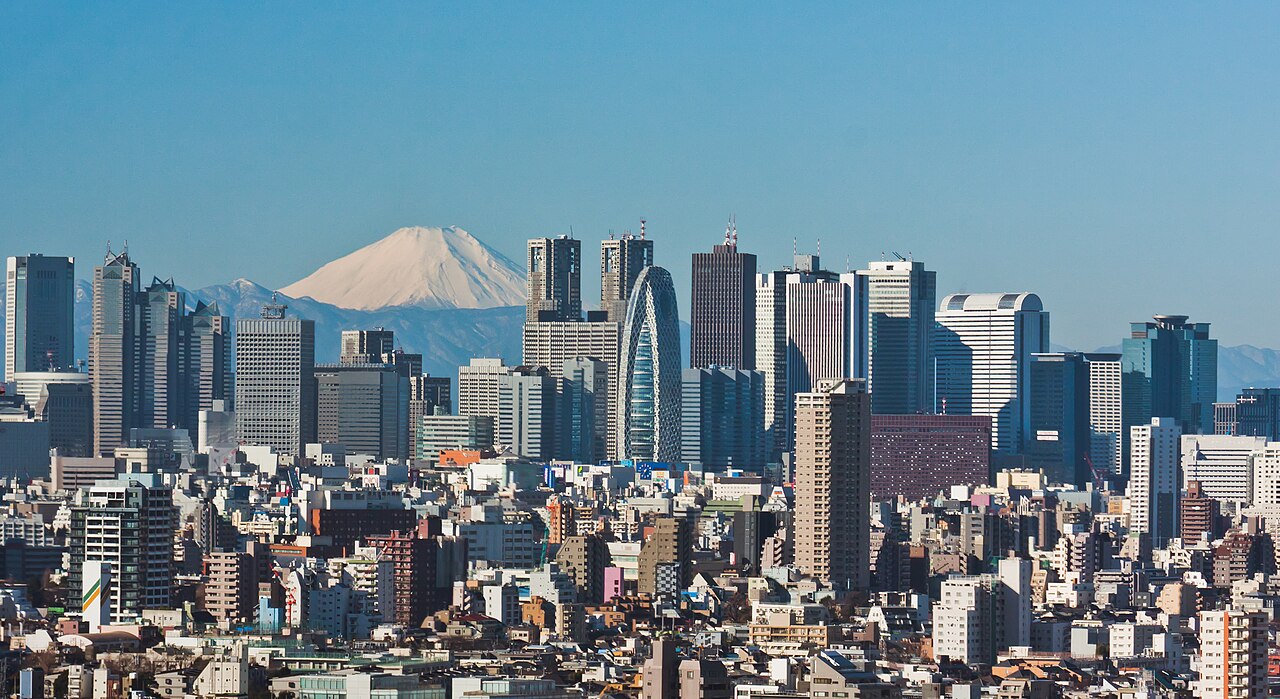
Shinjuku ward, long synonymous with urban disorder, recorded 847 incidents—down from 912 in 2025. Yet Minato ward, traditionally perceived as affluent and secure, logged 623 cases, nearly matching Shibuya's 641. Data analysts at the Tokyo Institute for Urban Research note that property crimes, particularly bicycle theft and bag snatching, account for 58% of all reported offences across central wards, yet receive disproportionately less media attention than violent crime.
The numbers become more revealing when examined by time and location. Police records show that convenience store robberies in Chiyoda ward—typically occurring between 11 p.m. and 4 a.m.—dropped to just 12 cases, compared to 31 last year. Conversely, reports of fraud and online scams citywide jumped 19%, totalling 3,847 cases, with victims aged 60 and above comprising 64% of the total. Average loss per incident: ¥847,000.
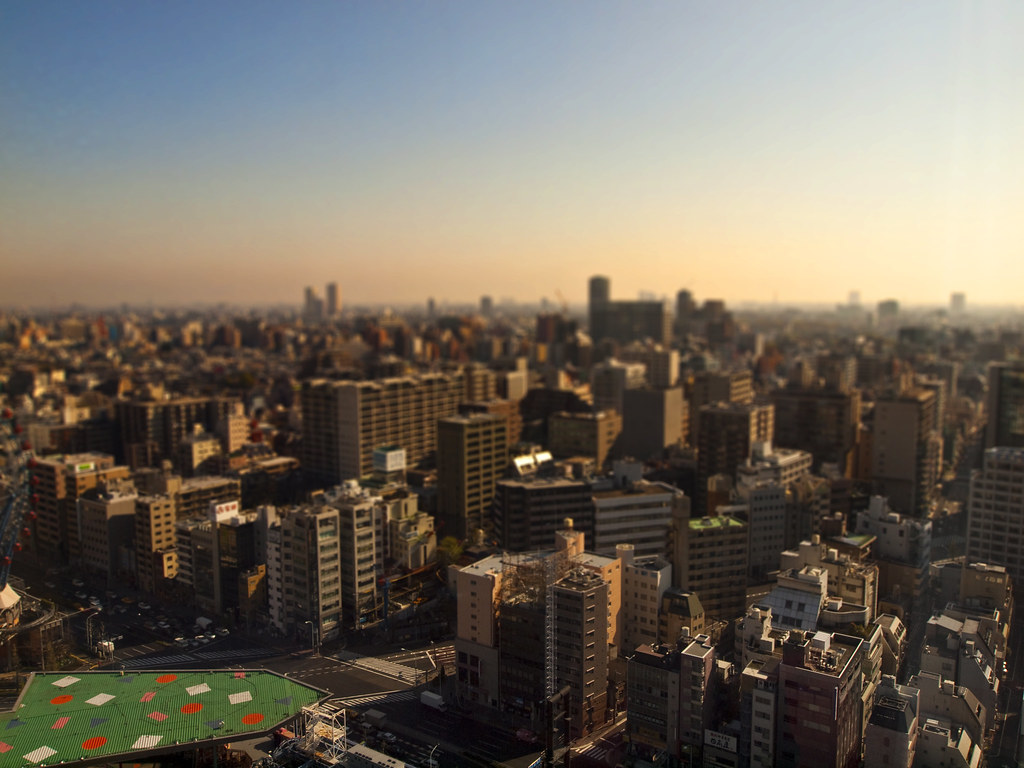
Emergency response times tell another story. The Tokyo Fire Department's data indicates that average response times to incidents in central Chuo ward remain under five minutes, while peripheral areas like parts of Adachi ward average 7.8 minutes. For a city of 14 million, the Tokyo Metropolitan Police operate with approximately 10,200 officers, translating to one officer per 1,373 residents—a ratio that has remained relatively stable despite population fluctuations.
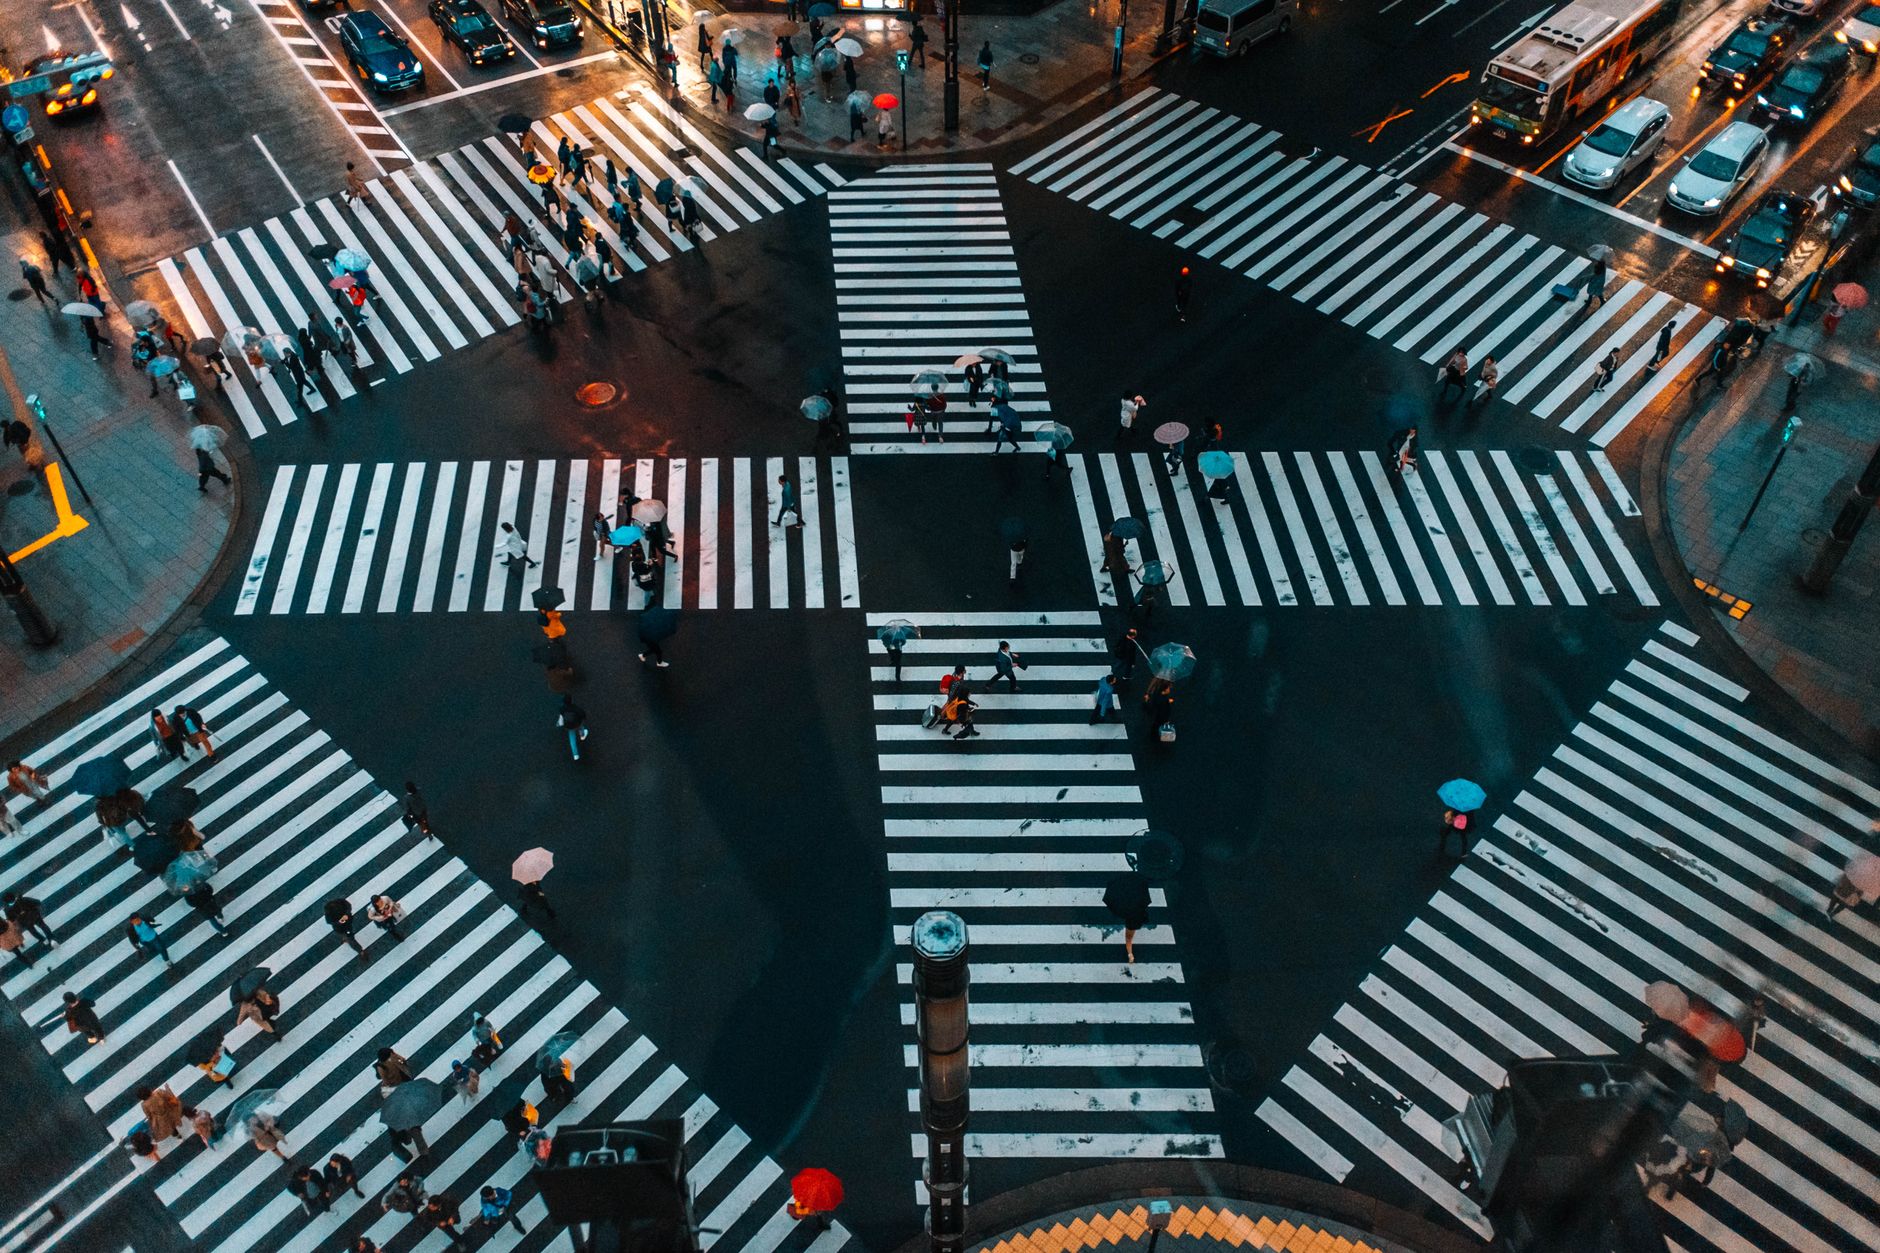
Street-level analysis from Roppongi to Kabukicho reveals that increased foot patrols correlate with lower incident rates. The Kabukicho Revitalization Project, which deployed an additional 45 officers across the entertainment district since March, corresponds with a 22% reduction in violent altercations in that specific area.
Perhaps most striking: neighbourhood councils reporting structured communication channels with local police divisions experience 31% fewer reported crimes than comparable areas without such infrastructure. The data suggests that Tokyo's safety metric cannot be reduced to a single number, but rather emerges from dozens of interlocking variables that researchers continue to parse with increasing precision.
This article was compiled by AI and screened before publishing. See our editorial standards.
How does this story make you feel?
Spread the word
About this article
Published by The Daily Tokyo
Daily brief
Free, in your inbox before 7am. Weekdays.
More in News